Statistics
Statistics
This page provides information on how to configure new statistics based on the information available on the repository. It is important to acknowledge, that in order to understand this information one must be an advanced user with knowledge of HTML, CSS and Javascript.
Statistics work by sending queries to RODA by means of its API (inspect the API documentation for more information), collecting the results and presenting them as graphics. The entire process is done on the client side by Javascript.
The following sections provide code snippets that one can use to display statistics about the status of the repository. One just needs to include the code snippets in a new HTML page and the included Javascript engine will handle all the communication, workload and presentation. New graphics and statistics can be created by changing the query “data” parameters included in the snippets (e.g. data-source-filters).
AIP Index
Total No. of descriptive records
<span class="statistic"
  data-source="index"
  data-source-class="org.roda.core.data.v2.ip.IndexedAIP"
  data-view="text"
  data-view-field="totalCount"></span>
Total No. of fonds
<span class="statistic"
  data-source="index"
  data-source-class="org.roda.core.data.v2.ip.IndexedAIP"
  data-source-filters="level=fonds"
  data-view="text"
  data-view-field="totalCount"></span>
Distribution of description levels
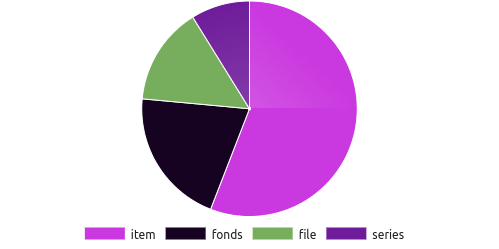
<canvas class="statistic"
        data-source="index"
        data-source-class="org.roda.core.data.v2.ip.IndexedAIP"
        data-source-facets="level"
        data-view="chart"
        data-view-limit="10"
        data-view-field="facetResults"
        data-view-type="pie"></canvas>
Representations Index
Total No. of Representations
<span class="statistic"
  data-source="index"
  data-source-class="org.roda.core.data.v2.ip.IndexedRepresentation"
  data-view="text"
  data-view-field="totalCount"></span>
Distribution of representation types
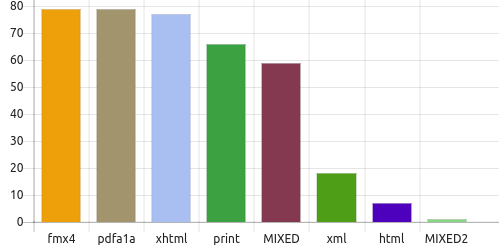
<canvas class="statistic"
        data-source="index"
        data-source-class="org.roda.core.data.v2.ip.IndexedRepresentation"
        data-source-facets="type"
        data-view="chart"
        data-view-limit="10"
        data-view-field="facetResults"
        data-view-type="bar"></canvas>
Files index
Total No. of files
<span class="statistic"
  data-source="index"
  data-source-class="org.roda.core.data.v2.ip.IndexedFile"
  data-view="text"
  data-view-field="totalCount"></span>
Distribution of mimetypes
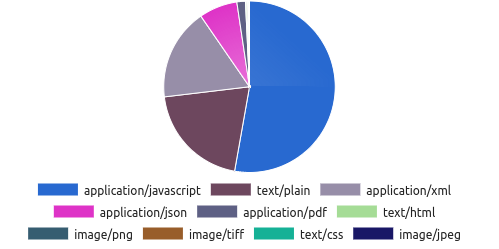
<canvas class="statistic"
        data-source="index"
        data-source-class="org.roda.core.data.v2.ip.IndexedFile"
        data-source-facets="formatMimetype"
        data-view="chart"
        data-view-limit="10"
        data-view-field="facetResults"
        data-view-type="pie"></canvas>
Distribution of PRONOM IDs
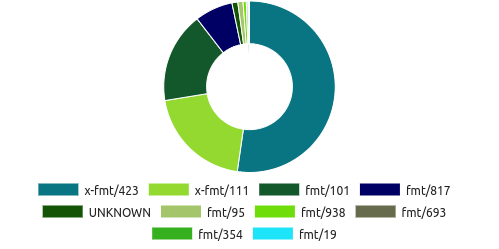
<canvas class="statistic"
        data-source="index"
        data-source-class="org.roda.core.data.v2.ip.IndexedFile"
        data-source-facets="formatPronom"
        data-view="chart"
        data-view-limit="10"
        data-view-field="facetResults"
        data-view-type="doughnut"></canvas>
Job index
Total No. of Ingest jobs
<span class="statistic"
  data-source="index"
  data-source-class="org.roda.core.data.v2.jobs.Job"
  data-source-filters="pluginType=INGEST, state=COMPLETED"
  data-source-facets="pluginType"
  data-view="text"
  data-view-field="totalCount"></span>
Log index
Total No. of logins
<span class="statistic"
  data-source="index"
  data-source-class="org.roda.core.data.v2.log.LogEntry"
  data-source-filters="actionComponent=org.roda.wui.api.controllers.UserLogin, actionMethod=login, state=SUCCESS"
  data-view="text"
  data-view-field="totalCount"></span>
Total No. of failed logins
<span class="statistic"
  data-source="index"
  data-source-class="org.roda.core.data.v2.log.LogEntry"
  data-source-filters="actionComponent=org.roda.wui.api.controllers.UserLogin, actionMethod=login, state=FAILURE"
  data-view="text"
  data-view-field="totalCount"></span>
Successful vs failed logins
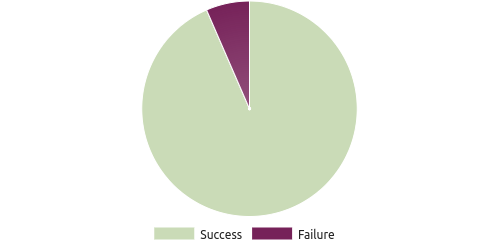
<canvas class="statistic"
        data-source="index"
        data-source-class="org.roda.core.data.v2.log.LogEntry"
        data-source-filters="actionComponent=org.roda.wui.api.controllers.UserLogin, actionMethod=login"
        data-source-facets="state"
        data-view="chart"
        data-view-limit="10"
        data-view-field="facetResults"
        data-view-type="pie"></canvas>
Other charts
Line charts
Description level distribution
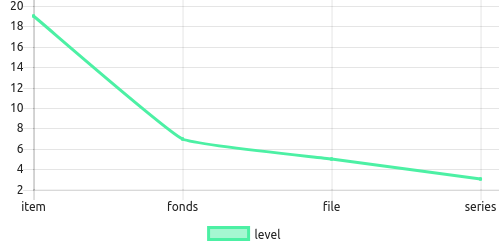
<canvas class="statistic"
        data-source="index"
        data-source-class="org.roda.core.data.v2.ip.IndexedAIP"
        data-source-facets="level"
        data-view="chart"
        data-view-limit="10"
        data-view-field="facetResults"
        data-view-type="line"></canvas>
Radar charts
Pronom format distribution
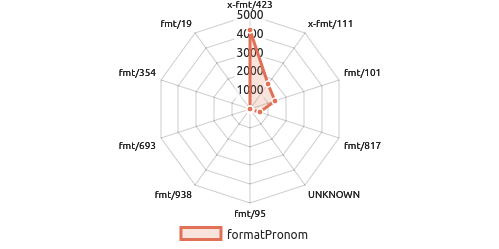
<canvas class="statistic"
        data-source="index"
        data-source-class="org.roda.core.data.v2.ip.IndexedFile"
        data-source-facets="formatPronom"
        data-view="chart"
        data-view-limit="10"
        data-view-field="facetResults"
        data-view-type="radar"></canvas>
Polar area charts
Pronom format distribution
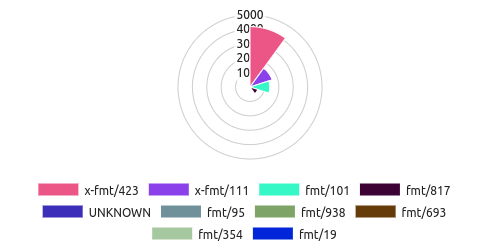
<canvas class="statistic"
        data-source="index"
        data-source-class="org.roda.core.data.v2.ip.IndexedFile"
        data-source-facets="formatPronom"
        data-view="chart"
        data-view-limit="10"
        data-view-field="facetResults"
        data-view-type="polarArea"></canvas>
Custom function to handle facet data
Pronom format distribution
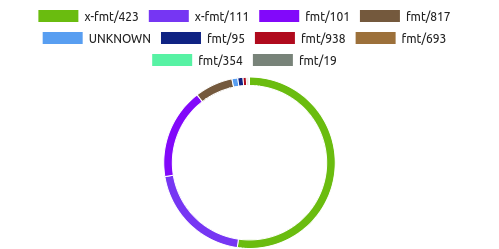
<canvas class="statistic"
        data-source="index"
        data-source-class="org.roda.core.data.v2.ip.IndexedFile"
        data-source-facets="formatPronom"
        data-view="chart"
        data-view-limit="10"
        data-view-field="facetResults"
        data-view-type="function"
        data-view-type-function="facetCustomDataHandlerChartOptions"></canvas>
<script type="text/javascript">
    function facetCustomDataHandlerChartOptions(data, element){
        var options = {};
        var facet = data.facetResults.length > 0 ? data.facetResults[0] : null;
        if (facet) {
            options = {
                type: "pie",
                data: {
                    labels: facet.values.map(function (value) {
                        return value.label;
                    }),
                    datasets: [{
                        label: facet.field,
                        data: facet.values.map(function (value) {
                            return value.count;
                        }),
                        backgroundColor: facet.values.map(function () {
                            return rgbaRandomOpaqueColorAsString();
                        })
                    }]
                },
                options: {
                    cutoutPercentage: 90
                }
            };
        }
        return options;
    }
</script>
Custom function to create chart
Bubble chart

<canvas class="statistic"
        data-source="function"
        data-function="customDataBubbleChart"></canvas>
<script type="text/javascript">
    function customDataBubbleChart(element) {
        new Chart(element, {
            type: 'bubble',
            data: {
                datasets: [{
                    label: "Test dataset",
                    data: [-3,-2,-1,0,1,2,3].map(function (value) {
                        return {
                            x: value,
                            y: value * value,
                            r: Math.abs(value) * 10
                        };
                    }),
                    backgroundColor: rgbaRandomOpaqueColorAsString(),
                    hoverBackgroundColor: rgbaRandomOpaqueColorAsString()
                }]
            }
        });
    }
</script>